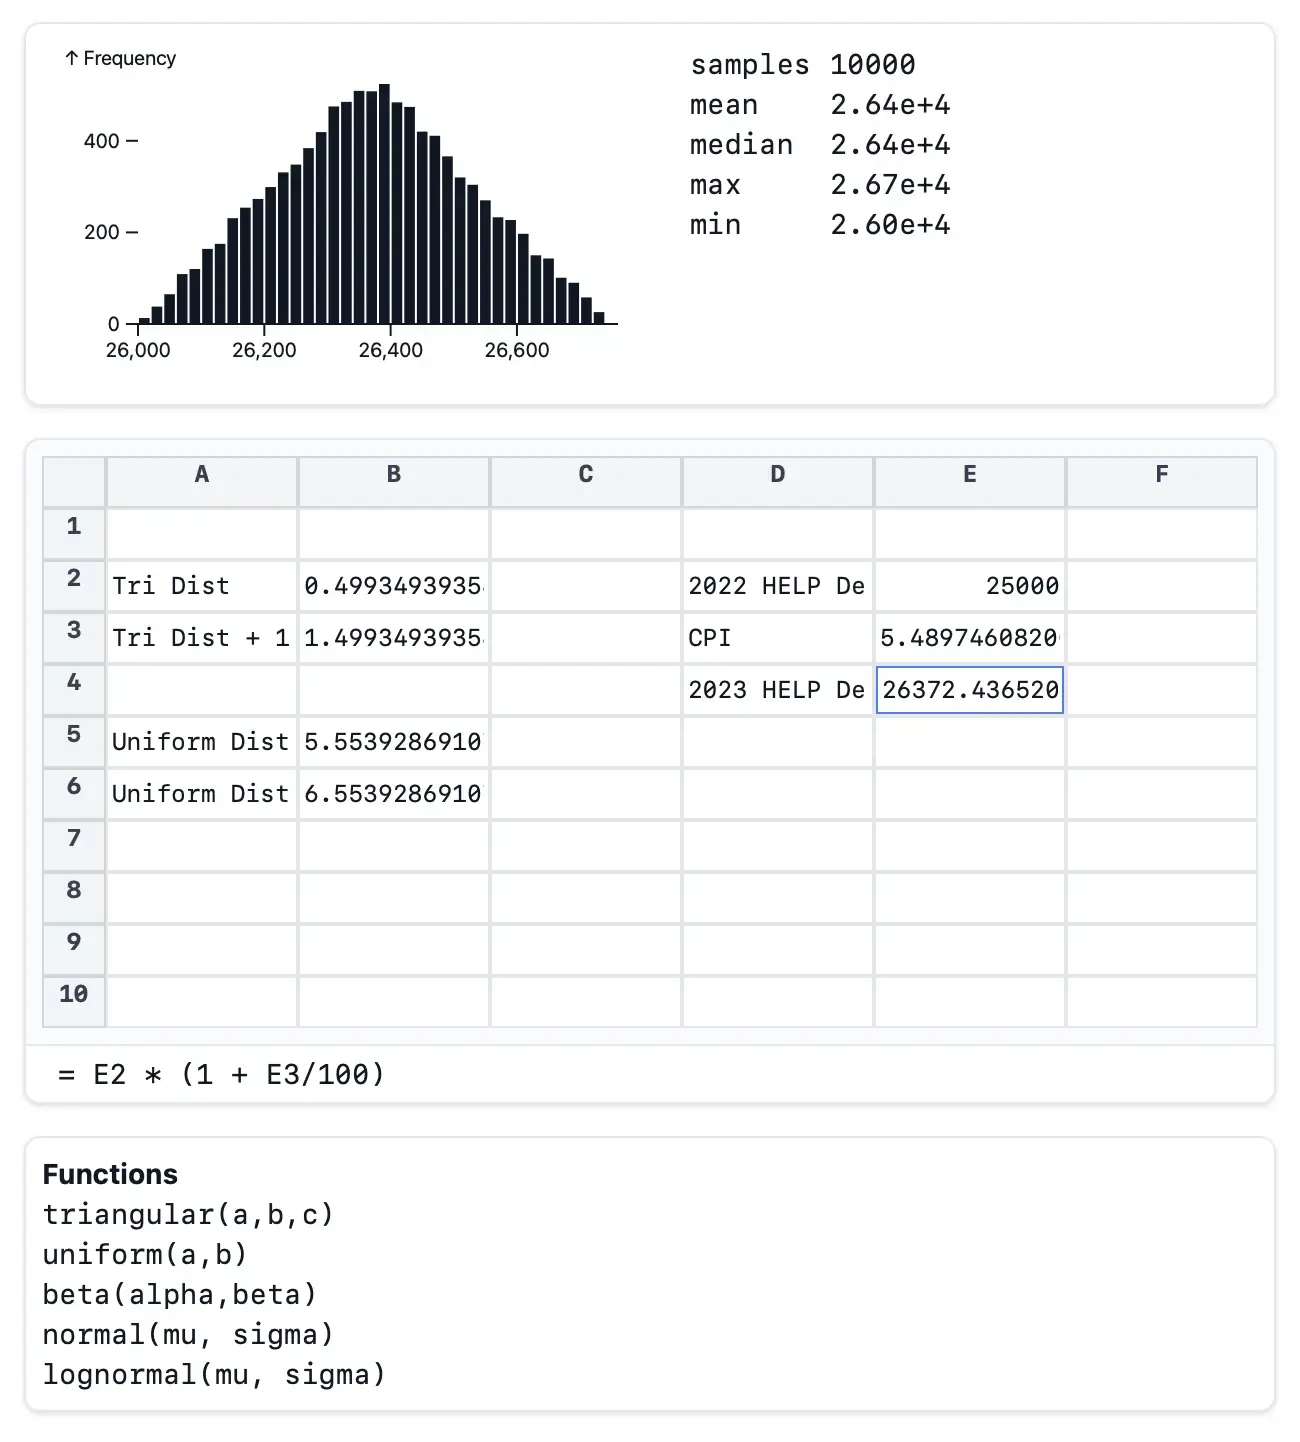
A very rough demo of the probability spreadsheet is available here. The source code is available on GitHub.
I want to create a spreadsheet that shows the effect of income, voluntary repayments, and indexation rate on the time it takes to pay off a HELP loan. The motivator for this is the indexation of HELP loans to inflation, which is estimated to be between 6-7% this year.
A user should be able to enter income and indexation rate as a range, and the spreadsheet should show the time it takes to pay off the loan for each “combination”.
A similar problem exists when doing napkin maths for business planning. For example, a business might have “range estimates” for the following:
- monthly user growth (e.g. 10-20%)
- annual headcount growth
- salary increases
- churn
These “range estimates” can be described as a probability distribution, and the spreadsheet should be able to show the effect of each of these on the final result.
For example when trying to calculate the profit of a subscription-based business,
income = subscriber_count *  // subscriber_count is a probability distribution
         price               // price is a constant

expenses =
    (
        salary_increase *    // salary_increase is a probability distribution
        salaries             // salaries is a constant
    ) +
    (
        headcount_growth *   // headcount_growth is a probability distribution
        headcount *          // headcount is a constant
        average_salary       // average_salary is a constant
    )

profit = income - expenses   // profit is a probability distribution
It would then be interesting to see the how each “uncertainty” affects the final result.
The core problem is estimation with uncertainty. I want to be able to create a Directed Acyclic Graph (DAG) of the relationships between variables, and then be able to propagate uncertainty through the graph.
This is a problem that I’ve encountered more than enough times now.
Update
19 April 2023
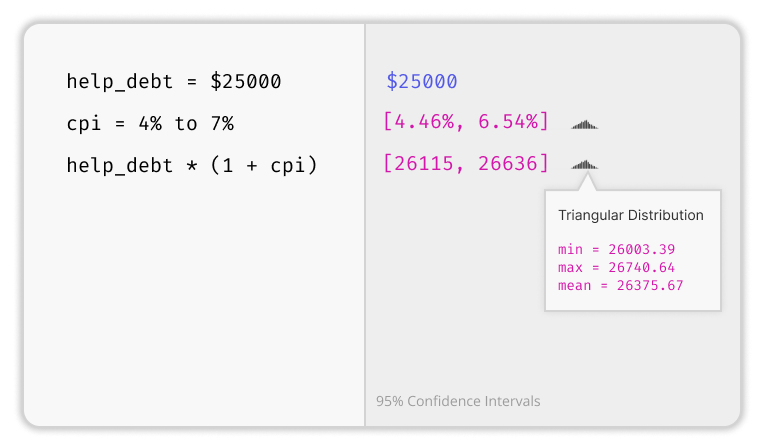
I’ve pivoted back to the original idea of a spreadsheet. I think it’s much easier to suspend state and do “what-if” analysis in a spreadsheet. I’ve also decided to not support natural language input. I’ve since discovered these wonderful tools:
13 April 2023
After thinking about this problem for while, I think a hybrid notepad/calculator (like Soulver) would be a better solution than a spreadsheet. Natural language input would be a nice-to-have, but not essential. It would be especially challenging to define a grammar for probability distributions.
An range estimate like “5 to 10 days” could be interpreted as a triangular distribution with a mean of 7.5 days. The calculator part would then show a sparkline of the distribution, with an option to change the distribution type and the parameters of the distribution.
Related Work
- Build Your Own Probabilty Monads
- Interactive uncertainty analysis
- Uncertain<T>: A First-Order Type for Uncertain Data
- @Risk - Probabilistic Risk Analysis in Excel
- Oracle Crystal Ball
- Guesstimate
- Causal App